FinTech | United Kingdom
Dedicated Investment Platform - Case Study United Kingdom
Mercuros is a dedicated investment app for those who want to invest and earn money in a passive way
Overview
Solution
MVP, Design
Duration
5 man-months
Team
1 x Backend Developer, 1 x DevOps, 1 x Frontend Developer, 1 x Project Manager
Engagement Model
Fixed Price
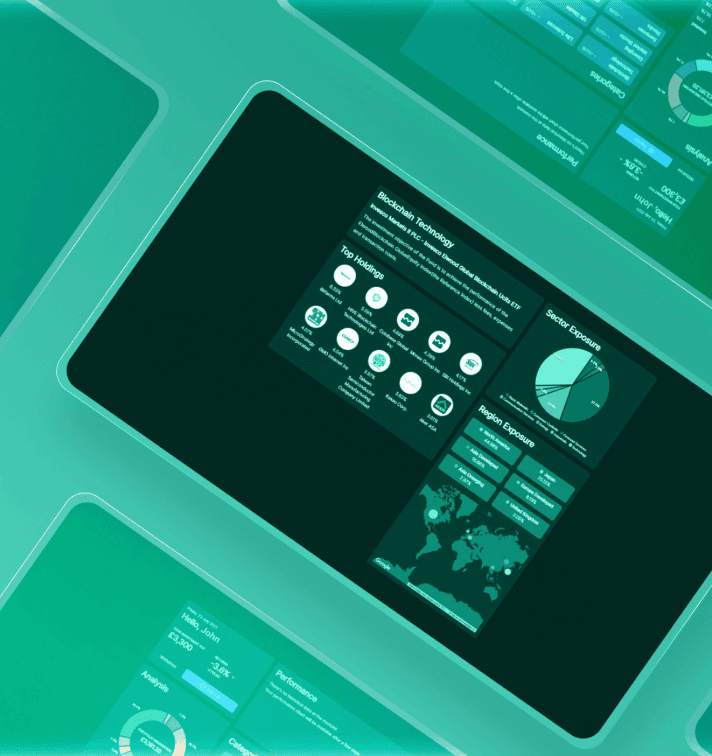
Mercuros is a dedicated investment app for those who want to invest and earn money in a passive way. Mercuros aims to grow an individual personal wealth while you relax and watch your portfolio grow. Inside the platform you get the chance to choose what kind of investor you want to become, starting from cautious to adventurous, and work on developing your personal investment plan.
This new exciting fintech application aims to empower anyone to invest, by starting with just £1. Each person that starts trading can withdraw his money at any time, without any additional charges, which makes the platform very attractive, as only a few trading apps in this industry enables you to do this action in a very straightforward way.
Mercuros invests in low-cost, but highly liquid index tracking exchange traded funds (ETFs) from leading financial providers to build a diversified portfolio, and keep all the costs as low as possible. This way all the focus and the possibility of maximizing your returns are at full capacity.
Built with


Key highlights
Deliver a complex system including various components having data processing in real-time
Keep the infrastructure and algorithms flexible to process data faster
Enable users to take multiple types of actions, through a simple interface
Implement an ongoing iterative process from one release to the next one
The challenge
One of the core challenges that we faced while building Mercuros was the delivery of the whole project in a short timeframe while integrating a series of complex systems. The platform needed a first place for interaction and user registration. While completing the sign-up process in a second phase, the app needed a payment integration, various subscription plans, and a dedicated reporting and analytics area, with custom charts and real-time data processing.
 The reporting area had to bring together a heavy pack of data, with many charts that were processing multiple types of data at the same time. Additionally, each user had to check an oversimplified dashboard to quickly understand what’s happening. Besides developing the features, we had to make sure we improved the current algorithms, to improve the speed and the processing systems of each pack of data.
Having a limited budget we had to optimize each page, button and functionality to fit the budget. In this way, from the design phase, we have tried to highlight what is the most important for the end users, by simplifying everything to have a good UI/UX and also enough to understand the value of the developed platform.
We had a couple of internal brainstorming sessions that helped us to bring good ideas to the surface. These ideas were projected by our designer and transformed very fast into something more visual, which were shared with the client for approval. The client brought his ideas which completed ideally what we have sketched.
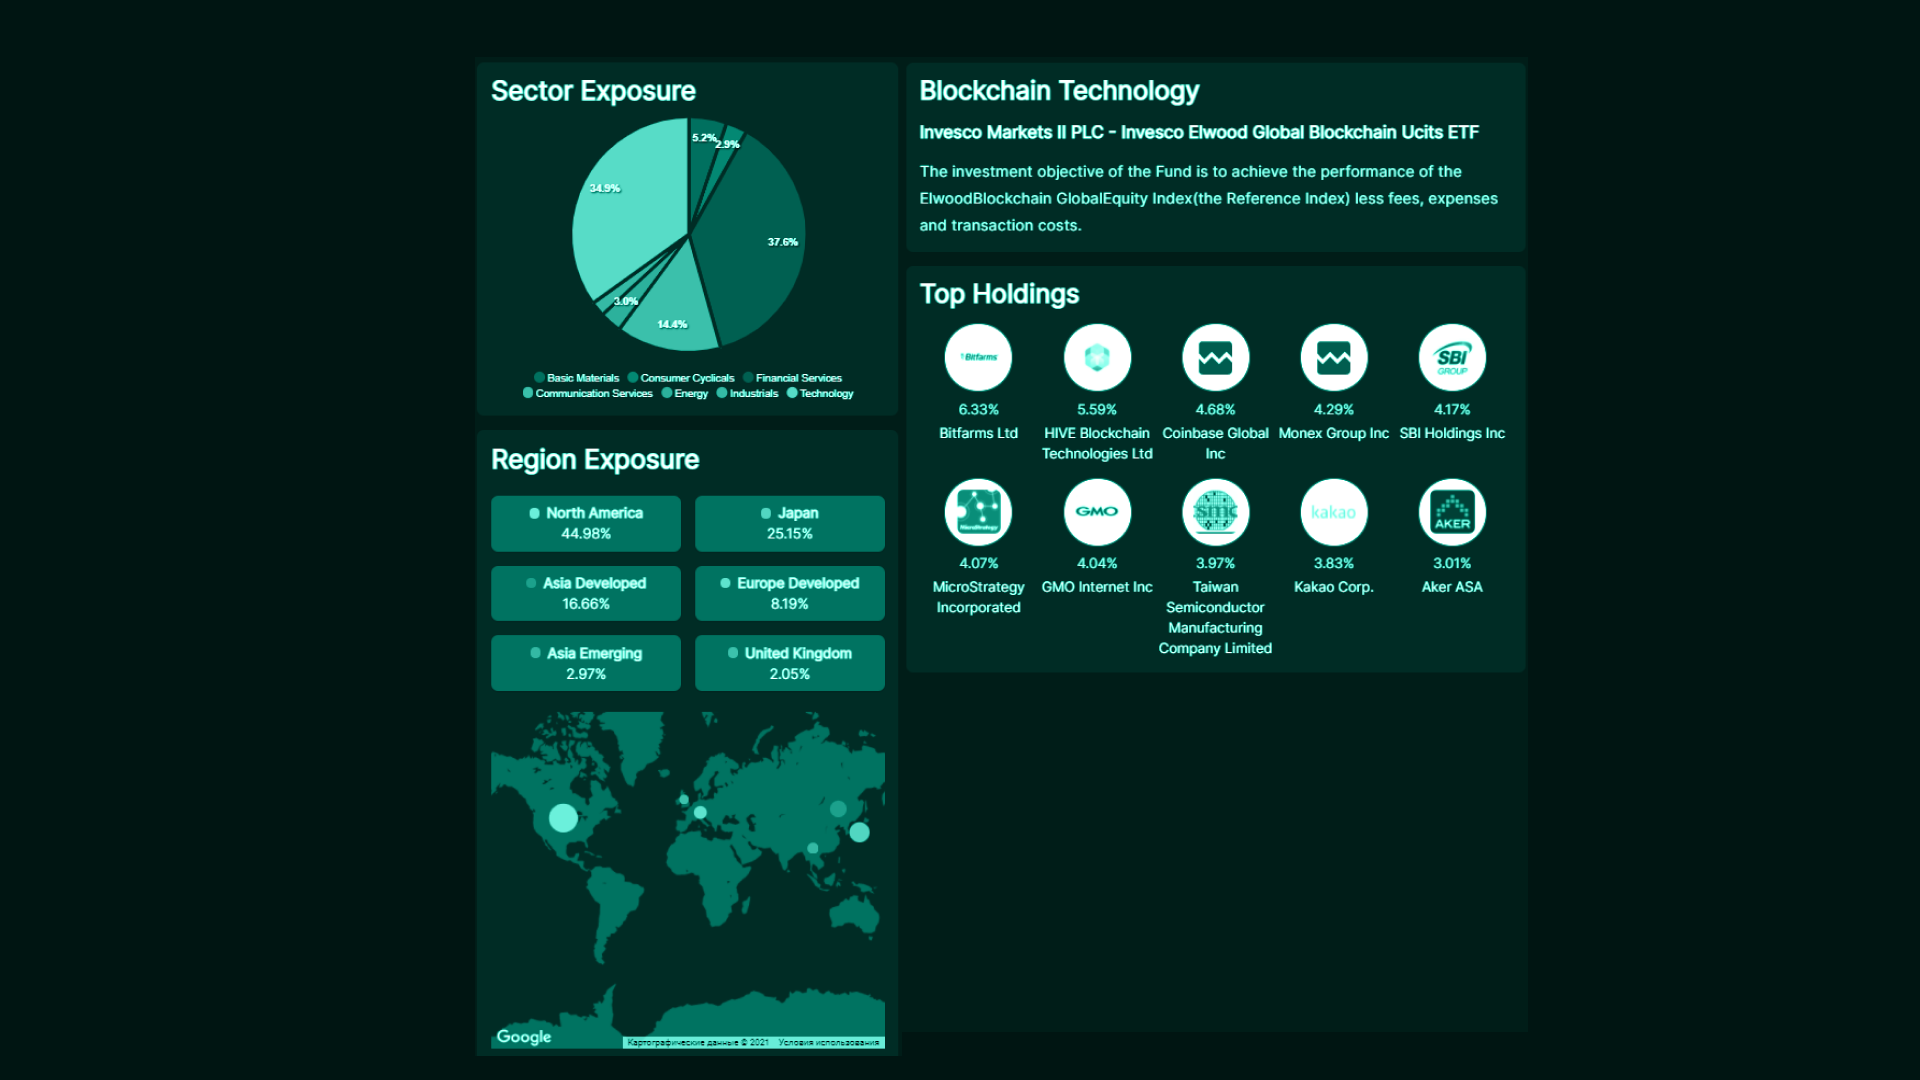 Our biggest effort was in finding the best charts to display all the information to the end user in a single page/web form, so he can make the right decision for the next investment rounds. As we always focus on the end user, we had to cut some functionalities from the Admin Panel just to focus more on the Customer App.
The result
The first version of the application included a beautiful design that gathered many positive feedback elements. At the same time, as soon as it engaged with its first users it received various reviews on how easy is to use due to the full pack of instructions and details that users have in their on boarding process.
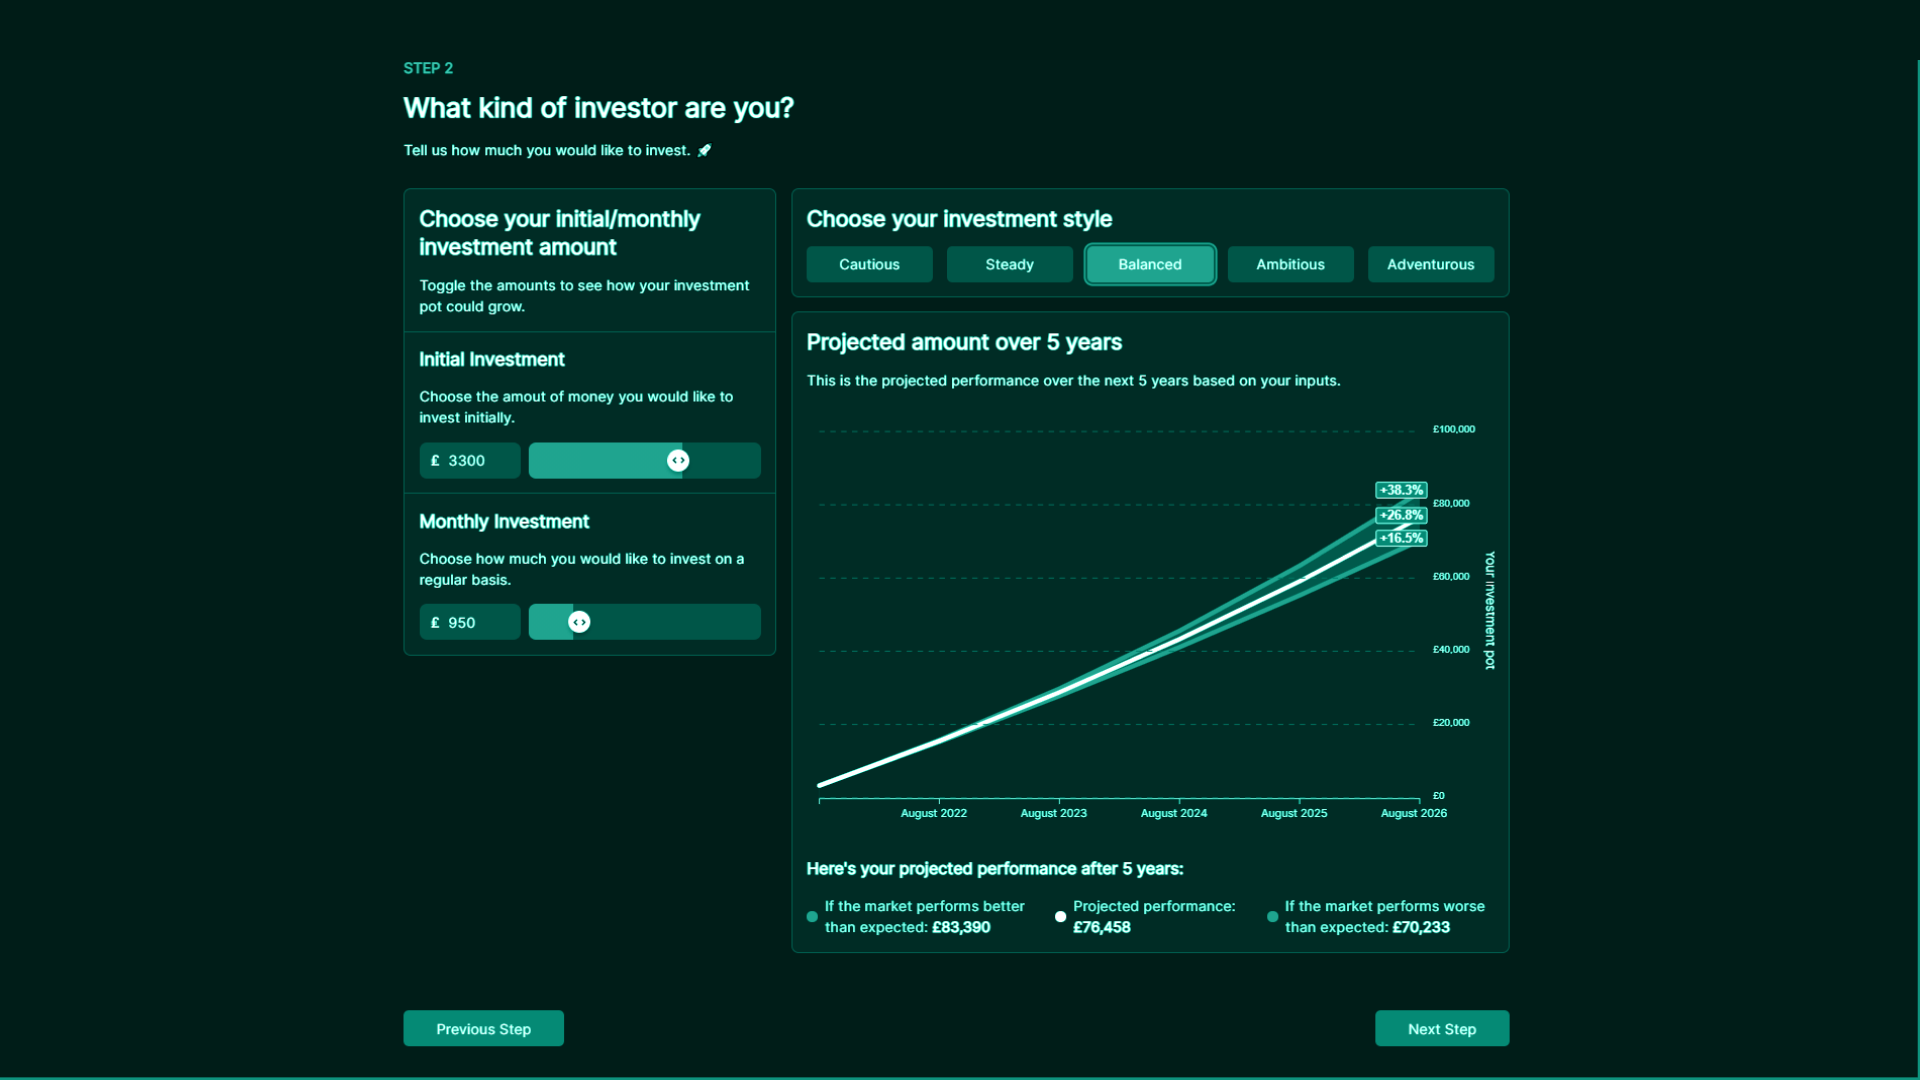 This first release was delivered successfully, and the feedback from the very first users helped us adapt the MVP and implement their action points in the next release. As more positive feedback we are getting, the closer we are to a new release.
Main features

Custom Charts
The users can personalize their charts having custom views

Real Time Data Processing
Take input of rapidly changing data and provide output using algorithms

Reporting & Analysis
Generate reports with data, charts, and graphs in an easy way to be analysed

User Registration
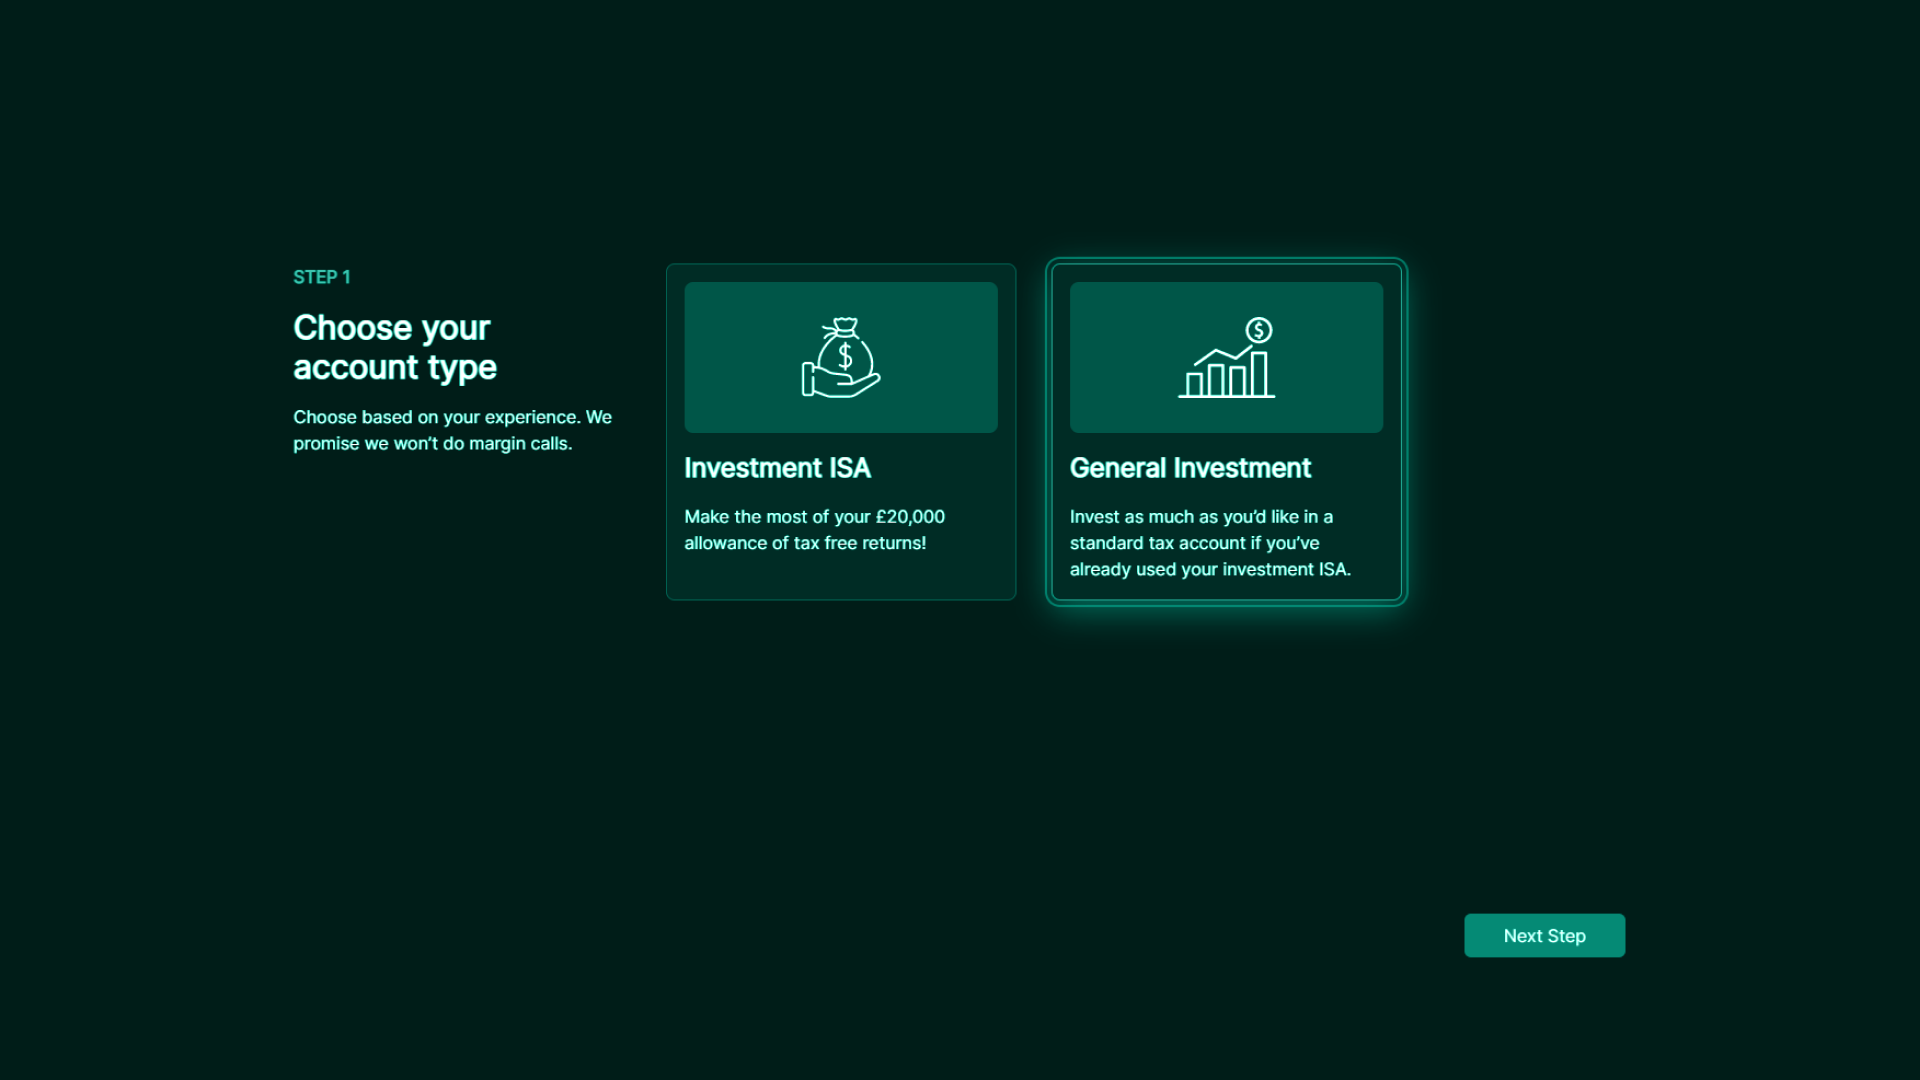
An easy way to create frontend user registration form and login form
